🚩 Create a free WhyLabs account to get more value out of whylogs!
Did you know you can store, visualize, and monitor whylogs profiles with theWhyLabs Observability Platform? Sign up for afree WhyLabs accountto leverage the power of whylogs and WhyLabs together!
Writing Profiles to WhyLabs#
![]()
In this example, we’ll show how to send your logged profiles to your monitoring dashboard at WhyLabs Platform. We will:
Define environment variables with the appropriate Credentials and IDs
Log data into a profile
Use the WhyLabs Writer to send the profile to your Project at WhyLabs
Installing whylogs#
First, let’s install whylogs. Since we want to write to WhyLabs, we’ll also install the whylabs extra.
If you don’t have it installed already, uncomment the line below:
[ ]:
# Note: you may need to restart the kernel to use updated packages.
%pip install 'whylogs>=1.5.0'
✔️ Setting the Environment Variables#
In order to send our profile to WhyLabs, let’s first set up an account. You can skip this if you already have an account and a model set up.
We will need three pieces of information:
API token
Organization ID
Dataset ID (or model-id)
Go to https://whylabs.ai/free and grab a free account. You can follow along with the examples if you wish, but if you’re interested in only following this demonstration, you can go ahead and skip the quick start instructions.
After that, you’ll be prompted to create an API token. Once you create it, copy and store it locally. The second important information here is your org ID. Take note of it as well. After you get your API Token and Org ID, you can go to https://hub.whylabsapp.com/models to see your projects dashboard. You can create a new project and take note of it’s ID (if it’s a model project it will look like model-xxxx).
You’ll now be prompted to enter the credentials. The WhyLabs Writer will use these variables in order to send the profiles to your dashboard.
[ ]:
import whylogs as why
import os

# Optionally you can override the AWS region that profiles get uploaded to when uploading to WhyLabs
# os.environ["WHYLABS_UPLOAD_REGION"] = 'ap-southeast-2'
why.init(allow_anonymous=False, upload_on_log=False)
<whylogs.api.whylabs.session.session.LocalSession at 0x7fe3f463edf0>
Fetching the Data#
For demonstration, let’s use data for transactions from a small retail business:
[ ]:
import pandas as pd

csv_url = "https://whylabs-public.s3.us-west-2.amazonaws.com/datasets/tour/current.csv"
df = pd.read_csv(csv_url)

df.head()
| Transaction ID | Customer ID | Quantity | Item Price | Total Tax | Total Amount | Store Type | Product Category | Product Subcategory | Gender | Transaction Type | Age | |
|---|---|---|---|---|---|---|---|---|---|---|---|---|
| 0 | T14259136777 | C274477 | 1 | 148.9 | 15.6345 | 164.5345 | TeleShop | Electronics | Audio and video | F | Purchase | 37.0 |
| 1 | T7313351894 | C267568 | 4 | 48.1 | 20.2020 | 212.6020 | Flagship store | Home and kitchen | Furnishing | M | Purchase | 25.0 |
| 2 | T37745642681 | C267098 | 1 | 10.9 | 1.1445 | 12.0445 | Flagship store | Footwear | Mens | F | Purchase | 42.0 |
| 3 | T13861409908 | C271608 | 2 | 135.2 | 28.3920 | 298.7920 | MBR | Footwear | Mens | F | Purchase | 43.0 |
| 4 | T58956348529 | C272484 | 4 | 144.3 | 60.6060 | 637.8060 | TeleShop | Clothing | Mens | F | Purchase | 39.0 |
📊 Profiling the Data#
Let’s profile the data with whylogs:
[ ]:
from datetime import datetime, timezone

profile = why.log(df, dataset_timestamp=datetime.now(tz=timezone.utc)).profile()
We’re also setting the profile’s dataset timestamp as the current datetime. If this is not set, the Writer would simply assign the current datetime automatically to the profile.
You can set the timestamp to past dates, if you want to backfill data into your dashboard. You should see data for the last 14 days at your dashboard within seconds or minutes once you send it.
✍️ The WhyLabs Writer#
Now, you can simply create a WhyLabsWriter object and use it to send your profiles, like this:
[ ]:
from whylogs.api.writer.whylabs import WhyLabsWriter

# The writer uses the same credentials that you set up in why.init
writer = WhyLabsWriter()
writer.write(profile)
(True, 'log-SluRuCMaglUHtWln')
A 200 response should mean that it went through successfully, and your status returned will be a tuple contained if the write was successful and the profile reference on WhyLabs if successful, otherwise an error string.
The writer expects a Profile View as parameter.
Option #2: Profile Result writer#
A second way to write to WhyLabs is by directly using the writer method of a Profile Result set, like this:
[ ]:
profile_results = why.log(df)
profile_results.writer("whylabs").write()
[(True, 'log-iPA3fD7K3IAXqwZk')]
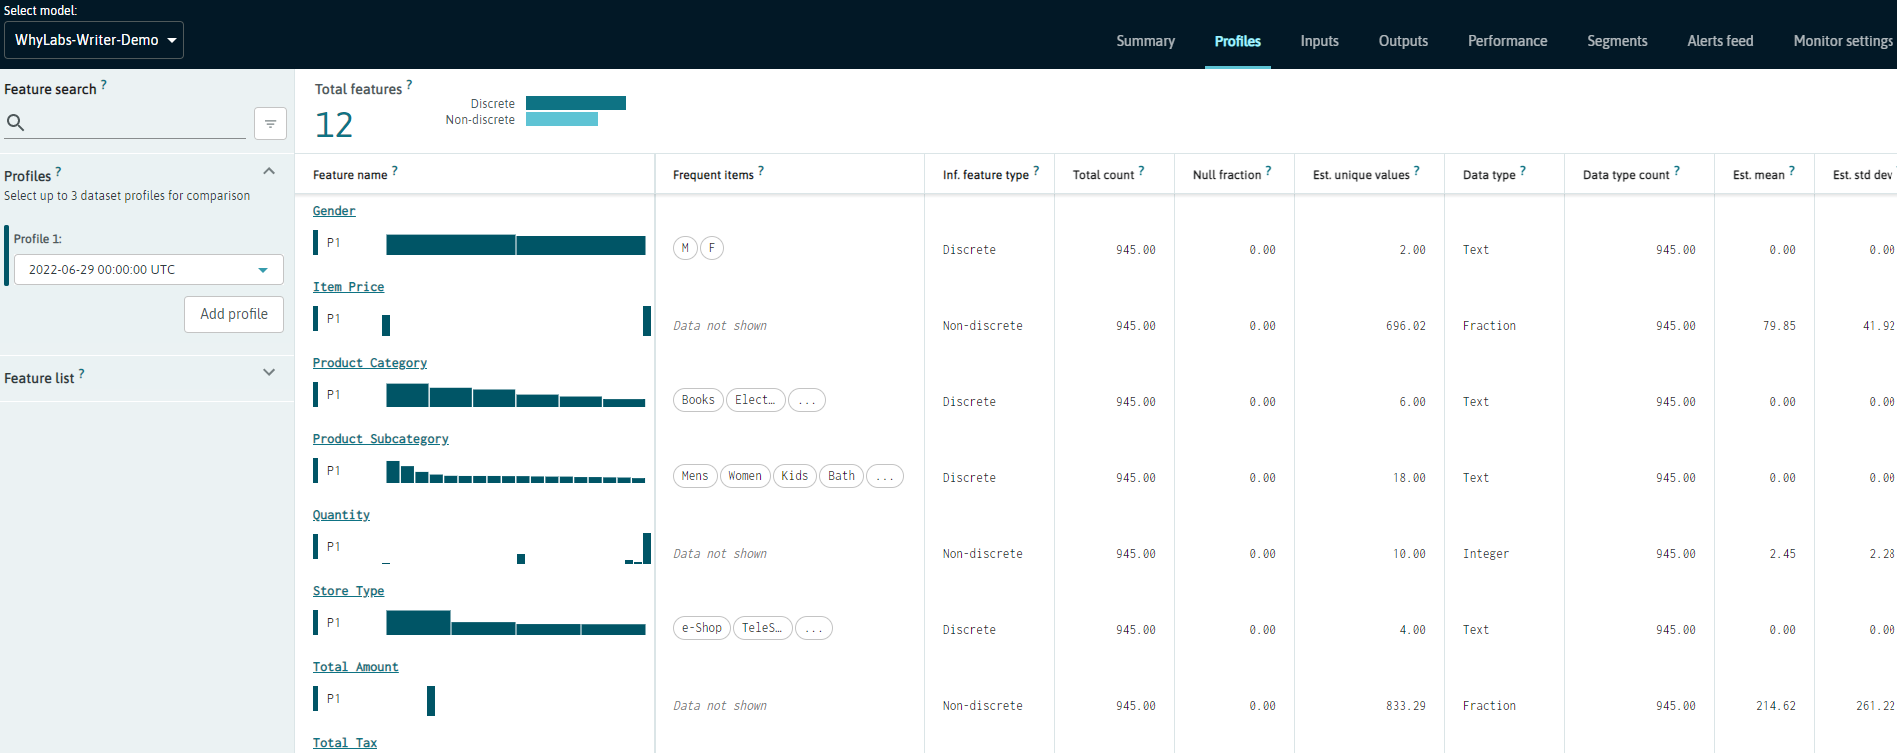
🔍 A Look on the Other Side#
Now, check your dashboard to verify everything went ok. At the Profile tab, you should see something like this:
Going from One to Many Profiles#
This was a simple example on how you can send a single profile to WhyLabs.
To better experience WhyLab’s features, try sending multiple profiles for a number of days to visualize how the feature’s metrics change over time! To do that, follow the same steps shown here, but setting the dataset timestamp to past days for backfill.
The following code snippet is a very simple way to do that. We’re just tweaking the code in the previous sessions in order to split the dataframe into seven chunks, and logging each chunk for a given day:
[ ]:
import numpy as np
from datetime import datetime, timedelta
from whylogs.api.writer.whylabs import WhyLabsWriter

writer = WhyLabsWriter()

df_splits = np.array_split(df, 7)

# This will log each data split for the last 7 days, starting with the current date and finishing 7 days in the past
for day, df_split in enumerate(df_splits):
    timestamp = datetime.now(tz=timezone.utc) - timedelta(days=day)
    profile = why.log(df, dataset_timestamp=timestamp).profile()
    writer.write(profile.view())
    print("Logged profile for {}".format(timestamp))
This should give you a quick way to look at how your features can be monitored over time!
Logging in a production service a rolling logger#
In a production service you can profile in line using a rolling logger as your telemetry gathering agent, which will aggregate the statistics over many messages or batches of your data, and the agen can be configured to write profiles with a configured interval to one or more destinations such as Whylabs, local disk, s3 etc.
Below we will use this same dataframe and split it into 100 pieces to mimic small batches of inputs in a service, and log these with a rolling logger configured to write to WhyLabs every 5 minutes. To make it easier to see what’s going on we also provide a callback on serialization, which gives access to the writer, the profile written, and a status.
[ ]:
import numpy as np
from whylogs.api.writer.whylabs import WhyLabsWriter
from whylogs.api.writer.writer import Writer
from whylogs.core.view.dataset_profile_view import DatasetProfileView


# step 0 - setup a serialization callback handler to debug/trace,
# replace the print with your own application logging
def upload_callback(writer: Writer, profile: DatasetProfileView, filename: str):
    print(f"Uploaded with {writer}, profile with timestamp: {profile.dataset_timestamp} and filename {filename}")

# step 1 setup the telemetry agent as a rolling logger and use the WhyLabs writer
telemetry_agent = why.logger(mode='rolling', interval=5, when="M", callback=upload_callback)
whylabs_writer = WhyLabsWriter()
telemetry_agent.append_writer(writer=whylabs_writer)
# you can also append writers by name with default configuration using env variables,
# below we append the default local disk profile writer for debug purposes,
# but it is easier to write only to WhyLabs in a production setup.
telemetry_agent.append_writer(name='local')

# step 2 some fake data in batches, typically this would be service traffic or batches of your data in a map/reduce setup.
total_batches = 10
df_splits = np.array_split(df, total_batches)

# step 3 - log the fake data in batches, this loop will log each batch of the split, but won't create more than one profile.
for batch, df_split in enumerate(df_splits):
    print(f"profiling batch: {batch} out of {total_batches} batches of data")
    telemetry_agent.log(df_split)
At this point there should be several batches of data profiled, but there is stil a single compact dataset profile describing all this data. If we waited for the interval to expire (5 minutes after instantiating the telemetry agent), we should see an upload get triggered, and our upload_callback triggered, but the rolling logger also has a close() method so you can flush any profile data during an application shutdown ahead of the interval’s deadline. This will flush the profile.
[ ]:
telemetry_agent.close()
You now have a local copy of the profile, you can check it out, and it is also uploaded to your WhyLabs account where it will be merged with other profiles in the same monitoring time window (e.g. daily or hourly) based on the profiles timestamp.
[ ]:
!ls *.bin