🚩 Create a free WhyLabs account to get more value out of whylogs!
Did you know you can store, visualize, and monitor whylogs profiles with theWhyLabs Observability Platform? Sign up for afree WhyLabs accountto leverage the power of whylogs and WhyLabs together!
Monitoring Classification Model Performance Metrics#
![]()
In this tutorial, we’ll show how you can log performance metrics of your ML Model with whylogs, and how to send it to your dashboard at Whylabs Platform. We’ll follow a classification use case, where we’re predicting whether an incoming product should be offered a discount or not based on past transaction information.
We will:
Download Ecommerce Data for 7 days
Log daily input features with whylogs
Log daily classification performance metrics with whylogs
Write logged profiles to WhyLabs’ dashboard
Show performance summary at WhyLabs
Advanced: Monitor segmented performance metrics
Installing whylogs#
First, let’s install whylogs. Since we want to write to WhyLabs, we’ll install the whylabs extra. Additionally, we’ll use the datasets module, so let’s install it as well:
[ ]:
# Note: you may need to restart the kernel to use updated packages.
%pip install 'whylogs[datasets]'
🛍️ The Data - Ecommerce Dataset#
The Ecommerce dataset contains transaction information of several products for a popular grocery supermarket in India. It contains features such as the product’s description, category, market price and user rating.
The original data was sourced from Kaggle’s BigBasket Entire Product List. From the source data additional transformations were made, such as: oversampling and feature creation/engineering.
You can have more information about the resulting dataset and how to use it at https://whylogs.readthedocs.io/en/latest/datasets/ecommerce.html.
Downloading the data into daily batches#
Let’s download 7 batches with 7 days worth of data, corresponding to the last 7 days. We can use directly the datasets module for that.
[2]:
from whylogs.datasets import Ecommerce
from datetime import datetime, timezone, timedelta
dataset = Ecommerce()

start_timestamp = datetime.now(timezone.utc) - timedelta(days=6)
dataset.set_parameters(inference_start_timestamp=start_timestamp)

daily_batches = dataset.get_inference_data(number_batches=7)

#batches is an iterator, so let's get the list for this
daily_batches = list(daily_batches)
Since in this example we’re mainly concerned with classification metrics, let’s select a subset of the available features, for simplicity.
Input features:
product
sales_last_week
market_price
rating
category
Target feature:
output_discount
Prediction feature:
output_prediction
Score feature:
output_score, which is the class probability for the predicted class.
The target and prediction features are encoded as 0’s and 1’s. While this example would work just as well this way, let’s encode these categories to strings - discount and full price - for didactical purposes.
Let’s take a look at the resulting data for the first day:
[4]:
columns = ['product','sales_last_week','market_price','rating','category','output_discount','output_prediction','output_score']

df = daily_batches[0].data[columns]

df['output_discount'] = df['output_discount'].apply(lambda x: "discount" if x==1 else "full price")
df['output_prediction'] = df['output_prediction'].apply(lambda x: "discount" if x==1 else "full price")
df.head()
[4]:
| product | sales_last_week | market_price | rating | category | output_discount | output_prediction | output_score | |
|---|---|---|---|---|---|---|---|---|
| date | ||||||||
| 2023-01-10 00:00:00+00:00 | 1-2-3 Noodles - Veg Masala Flavour | 2 | 12.0 | 4 | Snacks and Branded Foods | full price | full price | 1.000000 |
| 2023-01-10 00:00:00+00:00 | Jaggery Powder - Organic, Sulphur Free | 1 | 280.0 | 3 | Gourmet and World Food | full price | full price | 0.571833 |
| 2023-01-10 00:00:00+00:00 | Pudding - Assorted | 3 | 50.0 | 4 | Gourmet and World Food | full price | discount | 0.600000 |
| 2023-01-10 00:00:00+00:00 | Perfectly Moist Dark Chocolate Fudge Cake Mix ... | 1 | 495.0 | 4 | Gourmet and World Food | full price | discount | 0.517833 |
| 2023-01-10 00:00:00+00:00 | Pasta/Spaghetti Spoon - Nylon, Silicon Handle,... | 1 | 299.0 | 3 | Kitchen, Garden and Pets | discount | discount | 0.950000 |
✔️ Setting the Environment Variables#
In order to send our profile to WhyLabs, let’s first set up an account. You can skip this if you already have an account and a model set up.
We will need three pieces of information:
API token
Organization ID
Dataset ID (or model-id)
Go to https://whylabs.ai/free and grab a free account. You can follow along with the examples if you wish, but if you’re interested in only following this demonstration, you can go ahead and skip the quick start instructions.
After that, you’ll be prompted to create an API token. Once you create it, copy and store it locally. The second important information here is your org ID. Take note of it as well. After you get your API Token and Org ID, you can go to https://hub.whylabsapp.com/models to see your projects dashboard. You can create a new project and take note of it’s ID (if it’s a model project it will look like model-xxxx).
[1]:
import getpass
import os

# set your org-id here - should be something like "org-xxxx"
print("Enter your WhyLabs Org ID")
os.environ["WHYLABS_DEFAULT_ORG_ID"] = input()

# set your datased_id (or model_id) here - should be something like "model-xxxx"
print("Enter your WhyLabs Dataset ID")
os.environ["WHYLABS_DEFAULT_DATASET_ID"] = input()


# set your API key here
print("Enter your WhyLabs API key")
os.environ["WHYLABS_API_KEY"] = getpass.getpass()
print("Using API Key ID: ", os.environ["WHYLABS_API_KEY"][0:10])
Enter your WhyLabs Org ID
Enter your WhyLabs Dataset ID
Enter your WhyLabs API key
Using API Key ID:
📊 Profiling the Data + Sending to WhyLabs#
Traditionally, data is logged by calling why.log(). In this case, we’ll use why.log_classification_metrics(). By setting log_full_data to True, we will log the complete dataframe as in why.log(), but additionally it will compute classification metrics and add them to your results. If you want to log only the the target, prediction, and score columns, without the complete data, you can simply call log_regression_metrics() without specifying log_full_data, which
defaults to False.
log_classification_metrics takes the complete dataframe as input (with input/output features, as well as your prediction, target and score column). We also have to define which column is our target (in this case, output_discount) and which is our prediction column (output_prediction in this case). Additionally, in order to generate confusion matrices and ROC curves, we will also define a score column (output_score).
Once the profile is logged, we can set it’s timestamp for the proper day as given by our batch’s timestamp.Now that we have properly timestamped profiles with regression metrics, we can use the writer method to send it to WhyLabs:
Note: for whylogs versions 1.1.13 and lower, the default behavior of
log_regression_metricswas logging the complete data, in addition to target and prediction columns. If you were using it in the older versions and wish to keep that behavior when updating whylogs, setlog_full_datato True.
[4]:
from whylogs.api.writer.whylabs import WhyLabsWriter
import whylogs as why


columns = ['product','sales_last_week','market_price','rating','category','output_discount','output_prediction','output_score']

for batch in daily_batches:
    dataset_timestamp = batch.timestamp

    df = batch.data[columns]
    df['output_discount'] = df['output_discount'].apply(lambda x: "discount" if x==1 else "full price")
    df['output_prediction'] = df['output_prediction'].apply(lambda x: "discount" if x==1 else "full price")

    print("logging data for date {}".format(dataset_timestamp))
    results = why.log_classification_metrics(
        df,
        target_column = "output_discount",
        prediction_column = "output_prediction",
        score_column="output_score",
        log_full_data=True
    )

    profile = results.profile()
    profile.set_dataset_timestamp(dataset_timestamp)

    print("writing profiles to whylabs...")
    results.writer("whylabs").write()
logging data for date 2022-09-07 00:00:00+00:00
writing profiles to whylabs...
logging data for date 2022-09-08 00:00:00+00:00
writing profiles to whylabs...
logging data for date 2022-09-09 00:00:00+00:00
writing profiles to whylabs...
logging data for date 2022-09-10 00:00:00+00:00
writing profiles to whylabs...
logging data for date 2022-09-11 00:00:00+00:00
writing profiles to whylabs...
logging data for date 2022-09-12 00:00:00+00:00
writing profiles to whylabs...
logging data for date 2022-09-13 00:00:00+00:00
writing profiles to whylabs...
And that’s it! You just sent your profiles to WhyLabs.
At your model’s dashboard, you should see the model metrics for the last seven days. For classification, the displayed metrics are:
Total output and input count
Accuracy
ROC
Precision-Recall chart
Confusion Matrix
Recall
FPR (false positive rate)
Precision
F1
Advanced Usage - Monitoring Segmented Performance Metrics#
You can also log performance metrics for specific segments of your data.
For example, let’s say we want to monitor the performance of our model according to the product’s category. We might be interested in comparing performance metrics of the complete data against a specific segment, such as Fruits & Vegetables or Beverages, for example, or compare one segment against another.
To do that, it’s very simple: we just need to specify the column we wish to segment on and pass that information to a Dataset Schema object, like this:
If you want to learn more about segments, please refer to this example.
[ ]:
from whylogs.core.segmentation_partition import segment_on_column
from whylogs.core.schema import DatasetSchema

segment_column = "category"
segmented_schema = DatasetSchema(segments=segment_on_column(segment_column))
Now, we can log the profiles as demonstraded previously, with two differences. We’ll pass the schema to the log_classification_metrics method, and also set the timestamp to the complete result set:
[ ]:
from whylogs.api.writer.whylabs import WhyLabsWriter
import whylogs as why


columns = ['product','sales_last_week','market_price','rating','category','output_discount','output_prediction','output_score']

for batch in daily_batches:
    dataset_timestamp = batch.timestamp

    df = batch.data[columns]
    df['output_discount'] = df['output_discount'].apply(lambda x: "discount" if x==1 else "full price")
    df['output_prediction'] = df['output_prediction'].apply(lambda x: "discount" if x==1 else "full price")

    print("logging data for date {}".format(dataset_timestamp))
    results = why.log_classification_metrics(
        df,
        target_column = "output_discount",
        prediction_column = "output_prediction",
        score_column="output_score",
        schema=segmented_schema,
        log_full_data=True
    )

    results.set_dataset_timestamp(dataset_timestamp)

    print("writing profiles to whylabs...")
    results.writer("whylabs").write()
Note that we’re passing segmented_schema as the schema parameter. This will tell whylogs to log the metrics for the complete data, as well as for each segment.
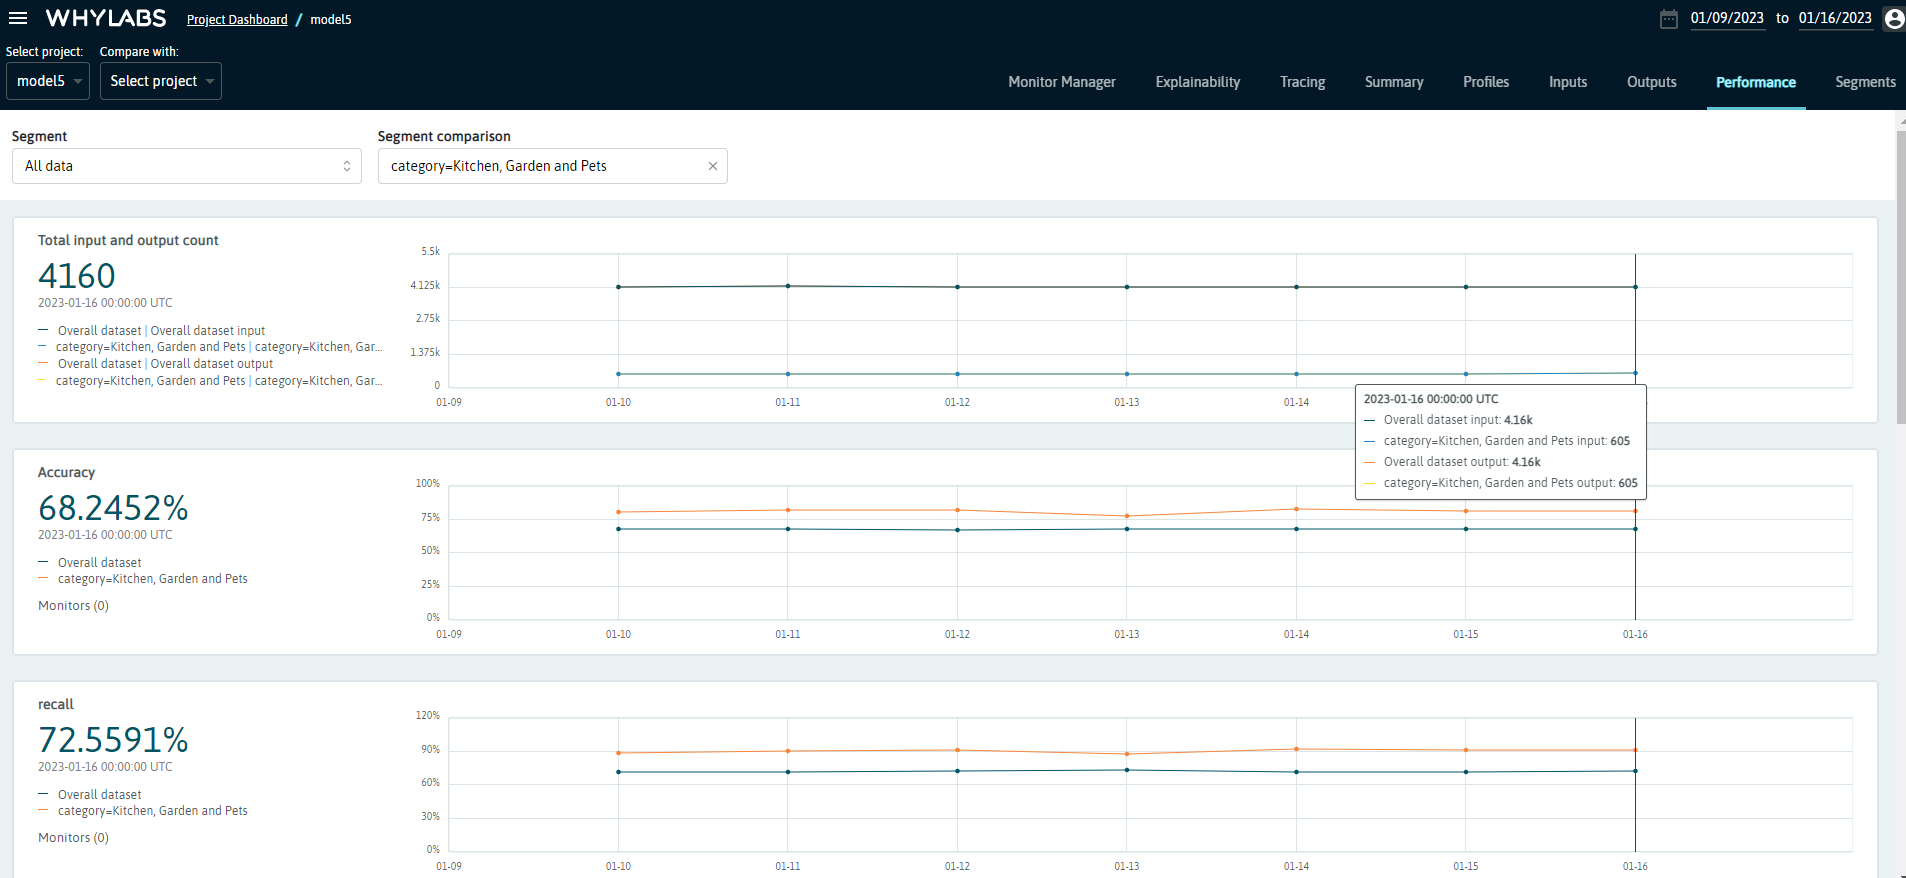
You’ll get a similar dashboard at the performance page at WhyLabs, but now you’ll see a dropdown menu with the available segments (or complete data). You’ll also be able to choose a second segment to compare against:
We can see that products in the Kitchen, Garden and Pets category represents around 14% of the total data (605/4160), and the classification model seems to perform consistently better for this category. You can verify it by exploring the other metrics on this dashboard, or look for other insights by exploring the other segments!