🚩 Create a free WhyLabs account to get more value out of whylogs!
Did you know you can store, visualize, and monitor whylogs profiles with theWhyLabs Observability Platform? Sign up for afree WhyLabs accountto leverage the power of whylogs and WhyLabs together!
Intro to Segmentation#
![]()
Sometimes, certain subgroups of data can behave very differently from the overall dataset. When monitoring the health of a dataset, it’s often helpful to have visibility at the sub-group level to better understand how these subgroups are contributing to trends in the overall dataset. whylogs supports data segmentation for this purpose.
Data segmentation is done at the point of profiling a dataset.
Segmentation can be done by a single feature or by multiple features simultaneously. For example, you could have different profiles according to the gender of your dataset (“M” or “F”), and also for different combinations of, let’s say, Gender and City Code. You can also further filter the segments for specific partitions you are interested in - let’s say, Gender “M” with age above 18.
In this example, we will show you a number of ways you can segment your data, and also how you can write these profiles to different locations.
Table of Content#
Segmenting on a single column
Segmenting on multiple columns
Filtering Segments
Writing Segmented Results to Disk
Sending Segmented Results to WhyLabs
Installing whylogs#
If you don’t have it installed already, install whylogs:
[ ]:
# Note: you may need to restart the kernel to use updated packages.
%pip install whylogs
Getting the Data & Defining the Segments#
Let’s first download the data we’ll be working with.
This dataset contains transaction information for an online grocery store, such as:
product description
category
user rating
market price
number of items sold last week
[1]:
import pandas as pd

url = "https://whylabs-public.s3.us-west-2.amazonaws.com/whylogs_examples/Ecommerce/baseline_dataset_base.csv"
df = pd.read_csv(url)[["date","product","category", "rating", "market_price","sales_last_week"]]
df['rating'] = df['rating'].astype(int)


df.head()
[1]:
| date | product | category | rating | market_price | sales_last_week | |
|---|---|---|---|---|---|---|
| 0 | 2022-08-09 00:00:00+00:00 | Wood - Centre Filled Bar Infused With Dark Mou... | Snacks and Branded Foods | 4 | 350.0 | 1 |
| 1 | 2022-08-09 00:00:00+00:00 | Toasted Almonds | Gourmet and World Food | 3 | 399.0 | 1 |
| 2 | 2022-08-09 00:00:00+00:00 | Instant Thai Noodles - Hot & Spicy Tomyum | Gourmet and World Food | 3 | 95.0 | 1 |
| 3 | 2022-08-09 00:00:00+00:00 | Thokku - Vathakozhambu | Snacks and Branded Foods | 4 | 336.0 | 1 |
| 4 | 2022-08-09 00:00:00+00:00 | Beetroot Powder | Gourmet and World Food | 3 | 150.0 | 1 |
Segmenting on a Single Column#
It looks like the category feature is a good one to segment on. Let’s see how many categories there are for the complete dataset:
[2]:
df['category'].value_counts()
[2]:
Beauty and Hygiene            9793
Gourmet and World Food        6201
Kitchen, Garden and Pets      4493
Snacks and Branded Foods      3826
Cleaning and Household        3446
Foodgrains, Oil and Masala    3059
Beverages                     1034
Bakery, Cakes and Dairy        979
Fruits and Vegetables          749
Baby Care                      707
Eggs, Meat and Fish            456
Name: category, dtype: int64
There are 11 categories.
We might be interested in having access to metrics specific to each category, so let’s generate segmented profiles for each category.
[3]:
from whylogs.core.segmentation_partition import segment_on_column

column_segments = segment_on_column("category")
[4]:
column_segments
[4]:
{'category': SegmentationPartition(name='category', mapper=ColumnMapperFunction(col_names=['category'], map=None, field_projector=<whylogs.core.projectors.FieldProjector object at 0x7fe82f5c9b80>, id='31aee7544d31ada00c3bb3d94ca2e0595c42a1f21c266da65e132168914ed61fe8b1b8c99aaa1a0c5cf5e2dfbd621aa3f9700bef1f6e85f4de4ca6364f149592'), id='8ff3ae39c46814563082fd6b3a9c0cfa922a8ef8dee5e685502485ed6482e4dcf7ecc3e4f7def5451c476c5b87485c1e0d9684c7ccf0f2cf3e2ba6106ec674d8', filter=None)}
column_segments is a dictionary for different SegmentationPartition, with informations such as id and additional logic. For the moment, all we’re interested in is that we can pass it to our DatasetSchema in order to generate segmented profiles while logging:
[5]:
import whylogs as why
from whylogs.core.schema import DatasetSchema

results = why.log(df, schema=DatasetSchema(segments=column_segments))
Since we had 11 different categories, we can expect the results to have 11 segments. Let’s make sure that is the case:
[6]:
print(f"After profiling the result set has: {results.count} segments")
After profiling the result set has: 11 segments
Great.
Now, let’s visualize the metrics for a single segment (the first one).
Results can have multiple partitions, and each partition can have multiple segments. Segments within a partition are non-overlapping. Segments across partitions, however, might overlap.
In this example, we have only one partition with 11 non-overlapping segments. Let’s fetch the available segments:
Now, let’s visualize the metrics for the first segment:
[14]:
first_segment = results.segments()[0]
segmented_profile = results.profile(first_segment)

print("Profile view for segment {}".format(first_segment.key))
segmented_profile.view().to_pandas()
Profile view for segment ('Baby Care',)
[14]:
| cardinality/est | cardinality/lower_1 | cardinality/upper_1 | counts/n | counts/null | distribution/max | distribution/mean | distribution/median | distribution/min | distribution/n | ... | distribution/stddev | frequent_items/frequent_strings | type | types/boolean | types/fractional | types/integral | types/object | types/string | ints/max | ints/min | |
|---|---|---|---|---|---|---|---|---|---|---|---|---|---|---|---|---|---|---|---|---|---|
| column | |||||||||||||||||||||
| category | 1.000000 | 1.0 | 1.000050 | 707 | 0 | NaN | 0.000000 | NaN | NaN | 0 | ... | 0.000000 | [FrequentItem(value='Baby Care', est=707, uppe... | SummaryType.COLUMN | 0 | 0 | 0 | 0 | 707 | NaN | NaN |
| date | 8.000000 | 8.0 | 8.000400 | 707 | 0 | NaN | 0.000000 | NaN | NaN | 0 | ... | 0.000000 | [FrequentItem(value='2022-08-15 00:00:00+00:00... | SummaryType.COLUMN | 0 | 0 | 0 | 0 | 707 | NaN | NaN |
| market_price | 57.000008 | 57.0 | 57.002854 | 707 | 0 | 2799.0 | 621.190948 | 299.0 | 50.0 | 707 | ... | 713.745256 | NaN | SummaryType.COLUMN | 0 | 707 | 0 | 0 | 0 | NaN | NaN |
| product | 69.000012 | 69.0 | 69.003457 | 707 | 0 | NaN | 0.000000 | NaN | NaN | 0 | ... | 0.000000 | [FrequentItem(value='Baby Powder', est=21, upp... | SummaryType.COLUMN | 0 | 0 | 0 | 0 | 707 | NaN | NaN |
| rating | 3.000000 | 3.0 | 3.000150 | 707 | 0 | 5.0 | 3.823197 | 4.0 | 3.0 | 707 | ... | 0.500566 | [FrequentItem(value='4', est=508, upper=508, l... | SummaryType.COLUMN | 0 | 0 | 707 | 0 | 0 | 5.0 | 3.0 |
| sales_last_week | 5.000000 | 5.0 | 5.000250 | 707 | 0 | 6.0 | 1.391796 | 1.0 | 1.0 | 707 | ... | 1.003162 | [FrequentItem(value='1', est=557, upper=557, l... | SummaryType.COLUMN | 0 | 0 | 707 | 0 | 0 | 6.0 | 1.0 |
6 rows × 28 columns
We can see that the first segment is for product transactions of the Baby Care category, and we have 707 rows for that particular segment.
Segmenting on More than one Column#
We might also be interested in segmenting based on more than one segment.
Let’s say we are interested in generating profiles for every combination of category and rating. That way, we can inspect the metrics for, let’s say, for Beverages with rating of 5.
[9]:
df['rating'].value_counts()
[9]:
4    15699
3    15340
5     1901
2     1222
1      581
Name: rating, dtype: int64
This time, we’ll use SegmentationPartition to create the partition:
[10]:
from whylogs.core.segmentation_partition import (
    ColumnMapperFunction,
    SegmentationPartition,
)

segmentation_partition = SegmentationPartition(
    name="category,rating", mapper=ColumnMapperFunction(col_names=["category", "rating"])
)
Let’s create our dictionary with the only partition we have:
[11]:
multi_column_segments = {segmentation_partition.name: segmentation_partition}
results = why.log(df, schema=DatasetSchema(segments=multi_column_segments))

print(f"After profiling the result set has: {results.count} segments")
After profiling the result set has: 46 segments
Again, let’s check the first segment:
[12]:
partition = results.partitions[0]
segments = results.segments_in_partition(partition)

first_segment = next(iter(segments))
segmented_profile = results.profile(first_segment)

print("Profile view for segment {}".format(first_segment.key))
segmented_profile.view().to_pandas()
Profile view for segment ('Baby Care', '3')
[12]:
| cardinality/est | cardinality/lower_1 | cardinality/upper_1 | counts/n | counts/null | distribution/max | distribution/mean | distribution/median | distribution/min | distribution/n | ... | distribution/stddev | frequent_items/frequent_strings | type | types/boolean | types/fractional | types/integral | types/object | types/string | ints/max | ints/min | |
|---|---|---|---|---|---|---|---|---|---|---|---|---|---|---|---|---|---|---|---|---|---|
| column | |||||||||||||||||||||
| category | 1.000000 | 1.0 | 1.000050 | 162 | 0 | NaN | 0.000000 | NaN | NaN | 0 | ... | 0.000000 | [FrequentItem(value='Baby Care', est=162, uppe... | SummaryType.COLUMN | 0 | 0 | 0 | 0 | 162 | NaN | NaN |
| date | 8.000000 | 8.0 | 8.000400 | 162 | 0 | NaN | 0.000000 | NaN | NaN | 0 | ... | 0.000000 | [FrequentItem(value='2022-08-15 00:00:00+00:00... | SummaryType.COLUMN | 0 | 0 | 0 | 0 | 162 | NaN | NaN |
| market_price | 15.000001 | 15.0 | 15.000749 | 162 | 0 | 2799.0 | 649.987654 | 265.0 | 149.0 | 162 | ... | 889.494280 | NaN | SummaryType.COLUMN | 0 | 162 | 0 | 0 | 0 | NaN | NaN |
| product | 16.000001 | 16.0 | 16.000799 | 162 | 0 | NaN | 0.000000 | NaN | NaN | 0 | ... | 0.000000 | [FrequentItem(value='Baby Sipper With Pop-up S... | SummaryType.COLUMN | 0 | 0 | 0 | 0 | 162 | NaN | NaN |
| rating | 1.000000 | 1.0 | 1.000050 | 162 | 0 | 3.0 | 3.000000 | 3.0 | 3.0 | 162 | ... | 0.000000 | [FrequentItem(value='3', est=162, upper=162, l... | SummaryType.COLUMN | 0 | 0 | 162 | 0 | 0 | 3.0 | 3.0 |
| sales_last_week | 3.000000 | 3.0 | 3.000150 | 162 | 0 | 4.0 | 1.271605 | 1.0 | 1.0 | 162 | ... | 0.705125 | [FrequentItem(value='1', est=134, upper=134, l... | SummaryType.COLUMN | 0 | 0 | 162 | 0 | 0 | 4.0 | 1.0 |
6 rows × 28 columns
The first segment is now for transactions of Baby Care category with rating of 3. There are 162 records for this specific segment.
Filtering the Segments#
You can further select data in a partition by using a SegmentFilter.
Let’s say you are interested only in the Baby Care category. Instead of generating all 11 segmented features, you can specify a SegmentFilter to get only one segment.
We can do so by specifying a filter function to the filter property of the Partition:
[13]:
from whylogs.core.segmentation_partition import segment_on_column
from whylogs.core.segmentation_partition import SegmentFilter

column_segments = segment_on_column("category")

column_segments['category'].filter = SegmentFilter(filter_function=lambda df: df.category=='Baby Care')
We’re passing a simple lambda function here, but you can define more complex scenarios by passing any Callable to it.
Now, we just repeat the logging process:
[14]:
import whylogs as why
from whylogs.core.schema import DatasetSchema

results = why.log(df, schema=DatasetSchema(segments=column_segments))

print(f"After profiling the result set has: {results.count} segments")
After profiling the result set has: 1 segments
We can see that now we have only 1 segment.
Filtering on other columns#
You don’t need to filter on the same category you’re segmenting on. In fact, you can use multiple columns to get very specific slices of interest for your data.
Unlike segmenting on multiple columns, with filtering you don’t need to get the segments for the complete cartesian product of your rules. This avoids combinatorial explosions for cases when you are interested in a very specific slice of your data, and are not particularly interested in all possible group combinations.
Let’s say high-quality, high-cost products are key to a certain promotion you want to release. You can create segments based on category, just as before, and can further filter it to track only data for your defined rule.
The only difference between this case and the previous one is the lambda function provided, but for reproducibility let’s repeat the whole code again:
[23]:
from whylogs.core.segmentation_partition import segment_on_column
from whylogs.core.segmentation_partition import SegmentFilter
import whylogs as why
from whylogs.core.schema import DatasetSchema

column_segments = segment_on_column("category")
column_segments['category'].filter = SegmentFilter(filter_function=lambda df: (df.market_price>200) & (df.rating > 3))

results = why.log(df, schema=DatasetSchema(segments=column_segments))

partition = results.partitions[0]
segments = results.segments_in_partition(partition)

first_segment = next(iter(segments))
segmented_profile = results.profile(first_segment)

print("Profile view for segment {}".format(first_segment.key))
segmented_profile.view().to_pandas()
Profile view for segment ('Baby Care',)
[23]:
| cardinality/est | cardinality/lower_1 | cardinality/upper_1 | counts/n | counts/null | distribution/max | distribution/mean | distribution/median | distribution/min | distribution/n | ... | distribution/stddev | frequent_items/frequent_strings | type | types/boolean | types/fractional | types/integral | types/object | types/string | ints/max | ints/min | |
|---|---|---|---|---|---|---|---|---|---|---|---|---|---|---|---|---|---|---|---|---|---|
| column | |||||||||||||||||||||
| category | 1.000000 | 1.0 | 1.000050 | 389 | 0 | NaN | 0.000000 | NaN | NaN | 0 | ... | 0.000000 | [FrequentItem(value='Baby Care', est=389, uppe... | SummaryType.COLUMN | 0 | 0 | 0 | 0 | 389 | NaN | NaN |
| date | 8.000000 | 8.0 | 8.000400 | 389 | 0 | NaN | 0.000000 | NaN | NaN | 0 | ... | 0.000000 | [FrequentItem(value='2022-08-12 00:00:00+00:00... | SummaryType.COLUMN | 0 | 0 | 0 | 0 | 389 | NaN | NaN |
| market_price | 32.000002 | 32.0 | 32.001600 | 389 | 0 | 2638.0 | 809.352185 | 495.0 | 215.0 | 389 | ... | 679.345870 | NaN | SummaryType.COLUMN | 0 | 389 | 0 | 0 | 0 | NaN | NaN |
| product | 38.000003 | 38.0 | 38.001901 | 389 | 0 | NaN | 0.000000 | NaN | NaN | 0 | ... | 0.000000 | [FrequentItem(value='Baby Powder', est=21, upp... | SummaryType.COLUMN | 0 | 0 | 0 | 0 | 389 | NaN | NaN |
| rating | 2.000000 | 2.0 | 2.000100 | 389 | 0 | 5.0 | 4.071979 | 4.0 | 4.0 | 389 | ... | 0.258787 | [FrequentItem(value='4', est=361, upper=361, l... | SummaryType.COLUMN | 0 | 0 | 389 | 0 | 0 | 5.0 | 4.0 |
| sales_last_week | 4.000000 | 4.0 | 4.000200 | 389 | 0 | 6.0 | 1.483290 | 1.0 | 1.0 | 389 | ... | 1.170009 | [FrequentItem(value='1', est=292, upper=292, l... | SummaryType.COLUMN | 0 | 0 | 389 | 0 | 0 | 6.0 | 1.0 |
6 rows × 28 columns
Notice that we now have a count of 389, whereas our first example had a count of 707. That’s because now we’re filtering the data to track only points that match our rule for high-quality, high-cost products.
Writing the Segments to Disk#
Once you have the segmented results, you can use the results’ writer method to write it to disk, for example:
[24]:
import os
directory = "segmented_profiles"
if not os.path.exists(directory):
    os.makedirs(directory)


results.writer().option(base_dir=directory).write()
This will write 11 binary profiles to the specified folder. Let’s check with listdir:
[18]:
os.listdir(directory)
[18]:
['profile_2022-09-13 13:47:12.595280_8ff3ae39c46814563082fd6b3a9c0cfa922a8ef8dee5e685502485ed6482e4dcf7ecc3e4f7def5451c476c5b87485c1e0d9684c7ccf0f2cf3e2ba6106ec674d8_Baby Care.bin',
 'profile_2022-09-13 13:47:12.606867_8ff3ae39c46814563082fd6b3a9c0cfa922a8ef8dee5e685502485ed6482e4dcf7ecc3e4f7def5451c476c5b87485c1e0d9684c7ccf0f2cf3e2ba6106ec674d8_Bakery, Cakes and Dairy.bin',
 'profile_2022-09-13 13:47:12.613083_8ff3ae39c46814563082fd6b3a9c0cfa922a8ef8dee5e685502485ed6482e4dcf7ecc3e4f7def5451c476c5b87485c1e0d9684c7ccf0f2cf3e2ba6106ec674d8_Beauty and Hygiene.bin',
 'profile_2022-09-13 13:47:12.643941_8ff3ae39c46814563082fd6b3a9c0cfa922a8ef8dee5e685502485ed6482e4dcf7ecc3e4f7def5451c476c5b87485c1e0d9684c7ccf0f2cf3e2ba6106ec674d8_Beverages.bin',
 'profile_2022-09-13 13:47:12.650850_8ff3ae39c46814563082fd6b3a9c0cfa922a8ef8dee5e685502485ed6482e4dcf7ecc3e4f7def5451c476c5b87485c1e0d9684c7ccf0f2cf3e2ba6106ec674d8_Cleaning and Household.bin',
 'profile_2022-09-13 13:47:12.661408_8ff3ae39c46814563082fd6b3a9c0cfa922a8ef8dee5e685502485ed6482e4dcf7ecc3e4f7def5451c476c5b87485c1e0d9684c7ccf0f2cf3e2ba6106ec674d8_Eggs, Meat and Fish.bin',
 'profile_2022-09-13 13:47:12.668325_8ff3ae39c46814563082fd6b3a9c0cfa922a8ef8dee5e685502485ed6482e4dcf7ecc3e4f7def5451c476c5b87485c1e0d9684c7ccf0f2cf3e2ba6106ec674d8_Foodgrains, Oil and Masala.bin',
 'profile_2022-09-13 13:47:12.678308_8ff3ae39c46814563082fd6b3a9c0cfa922a8ef8dee5e685502485ed6482e4dcf7ecc3e4f7def5451c476c5b87485c1e0d9684c7ccf0f2cf3e2ba6106ec674d8_Fruits and Vegetables.bin',
 'profile_2022-09-13 13:47:12.742280_8ff3ae39c46814563082fd6b3a9c0cfa922a8ef8dee5e685502485ed6482e4dcf7ecc3e4f7def5451c476c5b87485c1e0d9684c7ccf0f2cf3e2ba6106ec674d8_Gourmet and World Food.bin',
 'profile_2022-09-13 13:47:12.786080_8ff3ae39c46814563082fd6b3a9c0cfa922a8ef8dee5e685502485ed6482e4dcf7ecc3e4f7def5451c476c5b87485c1e0d9684c7ccf0f2cf3e2ba6106ec674d8_Kitchen, Garden and Pets.bin',
 'profile_2022-09-13 13:47:12.804480_8ff3ae39c46814563082fd6b3a9c0cfa922a8ef8dee5e685502485ed6482e4dcf7ecc3e4f7def5451c476c5b87485c1e0d9684c7ccf0f2cf3e2ba6106ec674d8_Snacks and Branded Foods.bin']
Sending Segmented Profiles to WhyLabs#
With the whylogs Writer, you can write your profiles to different locations. If you have a WhyLabs account, you can easily send your segmented profiles to be monitored in your dashboard.
We will show briefly how to do it in this example. If you want more details, please check the WhyLabs Writer Example (also available in our documentation).
Provided you already have the required information and keys, let’s first set our environment variables:
[18]:
import getpass
import os

# set your org-id here - should be something like "org-xxxx"
print("Enter your WhyLabs Org ID")
os.environ["WHYLABS_DEFAULT_ORG_ID"] = input()

# set your datased_id (or model_id) here - should be something like "model-xxxx"
print("Enter your WhyLabs Dataset ID")
os.environ["WHYLABS_DEFAULT_DATASET_ID"] = input()


# set your API key here
print("Enter your WhyLabs API key")
os.environ["WHYLABS_API_KEY"] = getpass.getpass()
print("Using API Key ID: ", os.environ["WHYLABS_API_KEY"][0:10])
Enter your WhyLabs Org ID
Enter your WhyLabs Dataset ID
Enter your WhyLabs API key
Using API Key ID:  ygG04qE3gQ
Then, it’s as simple as calling writer("whylabs"):
[ ]:
results.writer("whylabs").write()
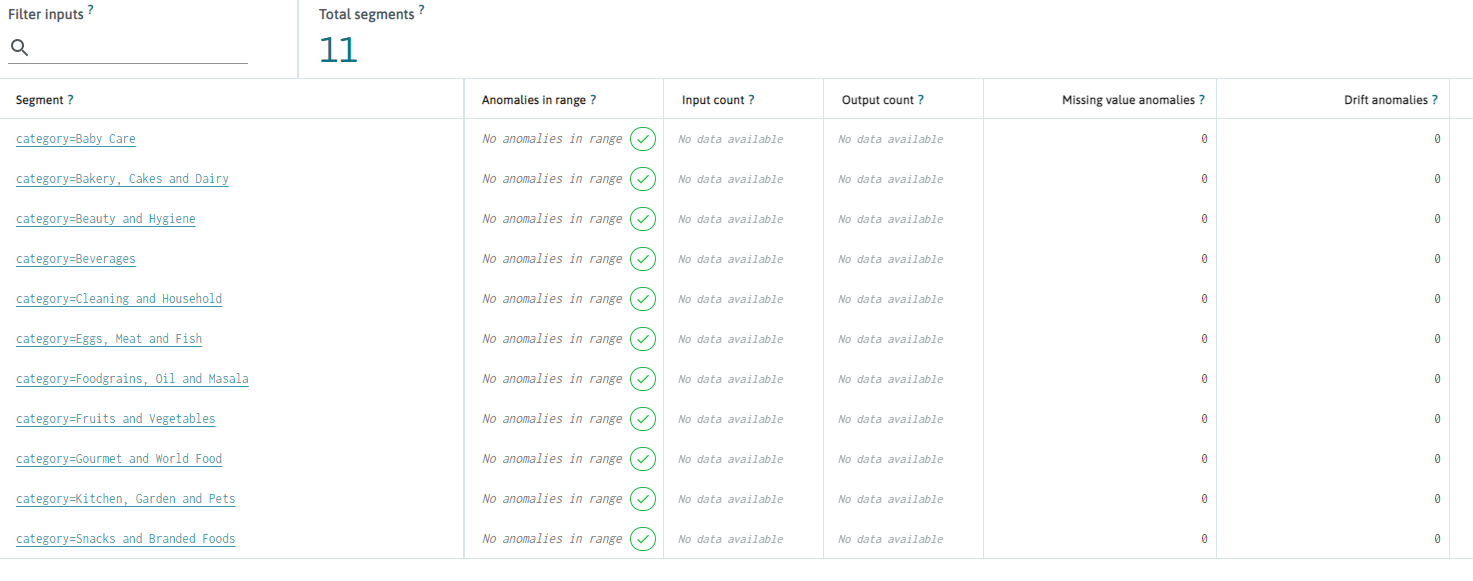
You should be able to see your segments at your dashboard at the segments tab: